p99 is not a tail: latency numbers that lie about chunked policies
We wanted to know why our latency numbers showed a fast policy with occasional hiccups. We logged every call's latency and marked where each motion chunk began. Every slow call was a full chunk inference, and the SmolVLA loop was blocked 39 % of each trial.
Engineering on the Orin · 7 of 8
Type: method · Result: For chunked policies p99 is one chunk inference; SmolVLA's synchronous loop is blocked 39 % of each trial. · n: 10 trials per row
Not proven: Synchronous loop only.
Compute: External GPU: no (Orin NX, M1 Mac, arm). Cost: $0. · Reproduce: 2026-09-29-three-policies-so101 · First published: 2026-10-26 · Updated: 2026-10-26 · Findings: p99 is not a tail for chunked policies →
My first gate runs reported select_action latency the usual way: p50 and p99 per trial. For SmolVLA on a Jetson Orin NX, p50 was a few milliseconds and p99 was about a second. That reads like a fast policy with an occasional hiccup.
It is not. Every one of those slow calls was a full chunk inference, on a fixed schedule, and the control loop spent 39 % of every trial blocked on them. For chunked policies, p50 and p99 describe two different operations, not one distribution.
The symptom
A chunked policy predicts H actions at once (ACT: 100, SmolVLA: 50) and queues them. The next H − 1 calls to select_action only pop the queue. When the queue is empty, the next call runs the model.
In a synchronous loop the robot waits for that call. On the arm this showed as a visible pause at every chunk, and the control-rate table looked inconsistent: - ACT on the Orin was twice as fast per inference as on the M1 Mac; - SmolVLA ran at about 19 Hz with about 130 ms of jitter on both machines.
How it was caught
The harness logs one tick file per trial, with the latency of every select_action call and its timestamp. A short script (shared/gate/chunk_latency.py) does three things:
- flags calls slower than 10 × the trial's median;
- checks whether each flagged call falls on a chunk boundary (call 0, H, 2H, …);
- plots the first 300 calls of one trial with the boundaries drawn.
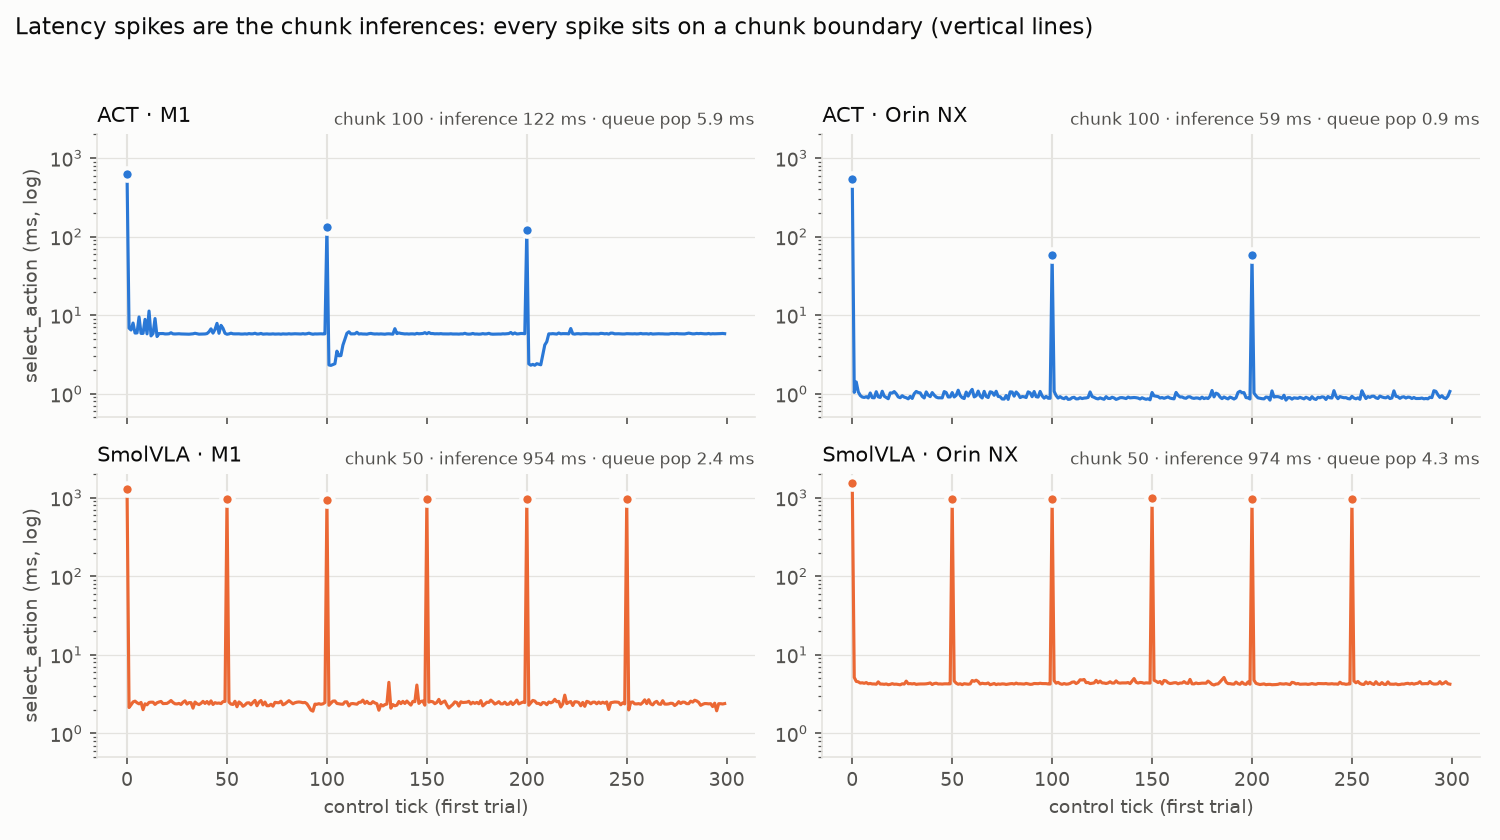
The spikes are not a tail. They are the boundaries:
| policy | machine | chunk | spikes on a chunk boundary | chunk inference | queue pop | p99 | chunk inferences / s | sync loop blocked |
|---|---|---|---|---|---|---|---|---|
| ACT | M1 | 100 | 100 % | 122 ms | 5.86 ms | 118 ms | 0.32 | 4 % |
| ACT | Orin NX | 100 | 100 % | 59 ms | 0.92 ms | 58 ms | 0.32 | 2 % |
| SmolVLA | M1 | 50 | 98 % | 954 ms | 2.42 ms | 954 ms | 0.41 | 39 % |
| SmolVLA | Orin NX | 50 | 100 % | 974 ms | 4.29 ms | 975 ms | 0.40 | 39 % |
10 trials of 25 s per row, 30 Hz loop, 2026-09-29. The two off-boundary SmolVLA spikes on the M1 (2 of 102) are isolated outliers.
What the right numbers say
- p50 is the queue pop. p99 is one chunk inference.
- The useful numbers are the time per chunk inference and how often it runs. Together they give how long the robot stalls and how often, and so the share of the trial the loop is blocked.
- The control-rate puzzle resolves. SmolVLA is bound by its own inference (about 0.95–0.97 s on both machines), so faster hardware did not help it. ACT, at 59 ms per 100 actions, barely blocks at all.
- The lever was not "more hardware". It was the engine, then asynchronous inference.
Moving SmolVLA from PyTorch to vla.cpp on the same Orin and checkpoint (2026-10-01, 10 trials each), the metrics that matter moved:
| SmolVLA PyTorch | vla.cpp defaults | vla.cpp --flash-attn --mm-prec default |
|
|---|---|---|---|
| chunk inference | 974 ms | 390 ms | 238 ms |
| sync loop blocked | 39 % | 20 % | 14 % |
| control Hz achieved | 19.32 | 24.59 | 26.56 |
| control jitter | 130.7 ms | 51.0 ms | 29.8 ms |
| success (n = 10) | 9/10 | 9/10 | 8/10 |
Spikes still sit on the boundaries (100 / 100 / 99 %). The stall is shorter, not gone. That is what led to running inference asynchronously, and to the chunk-boundary post.
What is not proven
- Synchronous loop only. The asynchronous loop on the arm, where inference overlaps execution, has not been timed end to end. That timing run (G13a) has not happened.
- n = 10 trials per row, one task, two machines. The percentages are stable across trials here, but this is not a benchmark suite.
- Success at n = 10 says nothing either way about the engine change (9 vs 9 vs 8). The
_faflags change numerics, and its two missed grasps are flagged, not explained.
The reusable check
For any chunked policy, compute these from per-call logs instead of reporting p50 / p99:
def summarize(trials: list[dict], chunk: int) -> dict:
    spikes, rest, on_boundary, blocked, wall = [], [], 0, 0.0, 0.0
    for t in trials:
        s = np.array(t["select_action_ms"])
        idx = np.where(s > 10 * np.median(s))[0]
        on_boundary += int(np.sum(idx % chunk == 0))
        spikes += s[idx].tolist()
        rest += np.delete(s, idx).tolist()
        ts = np.array(t["tick_ts"])
        wall += ts[-1] - ts[0]
        blocked += s[idx].sum() / 1e3
    return {
        "spikes": len(spikes),
        "on_boundary_pct": 100 * on_boundary / len(spikes),
        "chunk_ms": float(np.median(spikes)),
        "pop_ms": float(np.median(rest)),
        "p99_ms": float(np.percentile(spikes + rest, 99)),
        "chunks_per_s": len(spikes) / wall,
        "blocked_pct": 100 * blocked / wall,
    }
If on_boundary_pct is near 100, report chunk_ms, chunks_per_s and blocked_pct. Treat p99 as what it is: one inference.
Links
- Earlier posts:
- three policies on a €350 arm kit;
- SmolVLA four times faster with vla.cpp.
- Tick files and
chunk_latency.py: in my research repo, public with the replication repo. - Every test and verdict: the paper vs hardware page.
Compute. External GPU: no (Orin NX, M1 Mac, arm). Cost: $0.
Reproduce this: 2026-09-29-three-policies-so101
Engineering on the Orin, 7 of 8. ← Engineering on the Orin 6: Why your VLA's actions jump at every chunk boundary on real hardware, and a 0.4 ms fix · Engineering on the Orin 8: A correctness fix upstream made my checkpoint 47 % worse →